
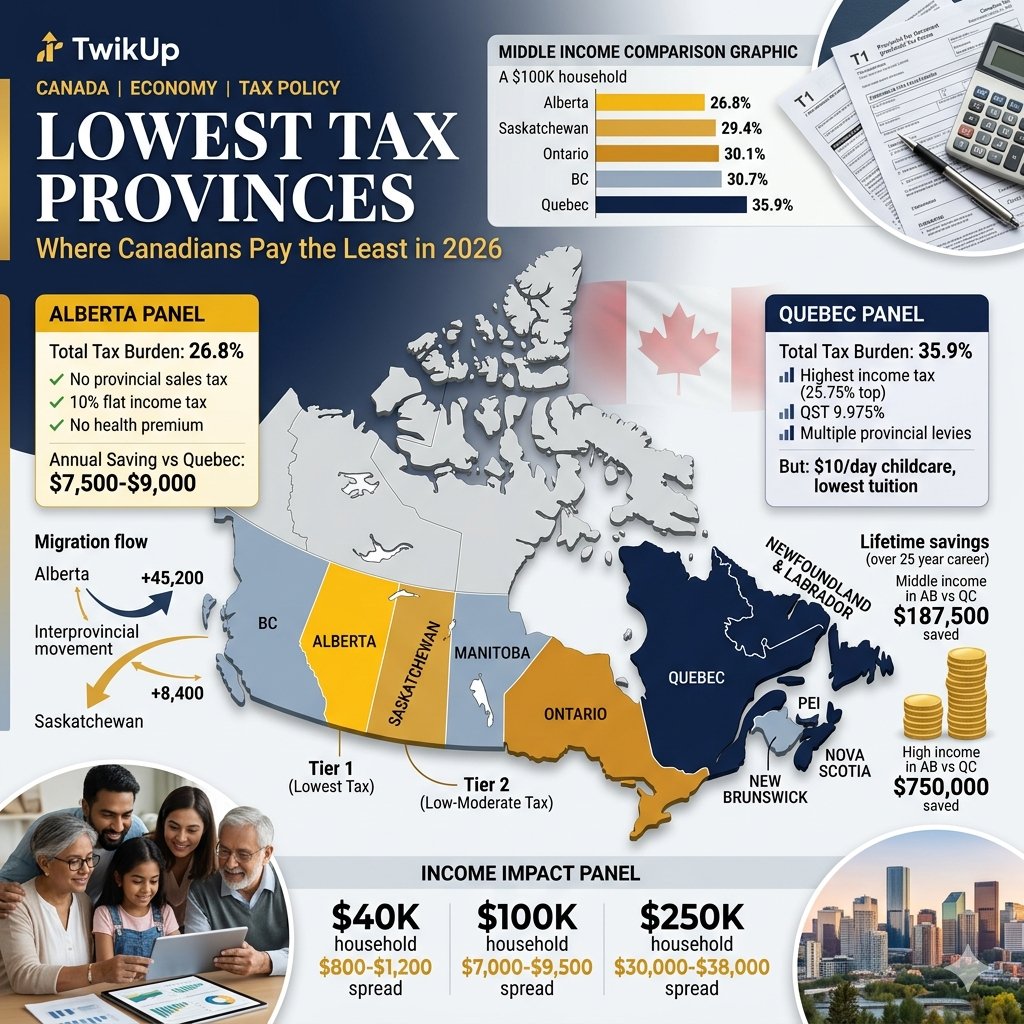
Where you live in Canada matters. A lot. Not just for climate, culture, or proximity to family, but for the single largest financial obligation you will face throughout your working life: taxes. The difference between living in the province with the highest tax burden and the province with the lowest can amount to hundreds of thousands of dollars over a career — enough to retire years earlier, buy a home outright, or build generational wealth for your children.
Canada is a federation of ten provinces and three territories, each with its own taxation system layered on top of the federal tax structure. While all Canadians pay the same federal income tax rates, provincial tax rates vary dramatically. When you add in provincial sales taxes, property taxes, payroll taxes, carbon taxes, health premiums, and the myriad smaller levies that fund provincial services, the total tax burden — the percentage of income an individual or household pays in combined taxes — diverges sharply across provincial borders.
This comprehensive analysis examines which Canadian provinces impose the lowest total tax burden on residents in 2026, how that burden is distributed across income levels, what you get (or don't get) for the taxes you pay, and how provincial tax policy is shaping migration, investment, and economic competitiveness across the country.
Defining "Tax Burden": What We're Measuring
The term "tax burden" sounds straightforward but requires careful definition. For the purposes of this analysis, we are measuring the total effective tax burden: the sum of all taxes paid by a household or individual as a percentage of total income. This includes:
Included in Total Tax Burden Calculation
| Tax Type | What It Includes |
|---|---|
| Personal income tax | Federal and provincial income tax on employment, self-employment, and investment income |
| Sales taxes | Provincial sales tax (PST), Harmonized Sales Tax (HST), Goods and Services Tax (GST), Quebec Sales Tax (QST) |
| Property taxes | Municipal and provincial property taxes on primary residence |
| Payroll taxes | Canada Pension Plan (CPP), Employment Insurance (EI), provincial health premiums, Quebec Pension Plan (QPP), Quebec Parental Insurance Plan (QPIP) |
| Carbon taxes | Federal and provincial carbon pricing mechanisms |
| Fuel taxes | Provincial and federal excise taxes on gasoline and diesel |
| Sin taxes | Alcohol and tobacco excise taxes |
| Vehicle and licensing fees | Provincial vehicle registration, driver licensing, and related fees |
Not Included (But Relevant)
This analysis does not include:
- Corporate taxes (which affect business owners but are not directly borne by wage earners)
- Customs and import duties (difficult to attribute individually)
- Indirect regulatory compliance costs
- User fees for specific services (park admission, tolls, etc.)
The analysis focuses on typical household tax burdens at representative income levels rather than attempting to calculate every possible individual scenario.
The Rankings: Provinces With the Lowest Total Tax Burden (2026)
Based on comprehensive modeling by the Fraser Institute, the C.D. Howe Institute, and independent tax analysis using 2026 tax rates, the provinces with the lowest total tax burden for a middle-income household (approximately $85,000 to $95,000 annual income, two adults, two children) are:
Overall Tax Burden Rankings (Middle-Income Household)
| Rank | Province | Total Tax Burden (% of Income) | Key Tax Advantages |
|---|---|---|---|
| 1 | Alberta | 26.8% | No provincial sales tax, low income tax rates, no health premium |
| 2 | Saskatchewan | 29.4% | Low PST (6%), competitive income tax, modest property taxes |
| 3 | Ontario | 30.1% | No health premium, moderate HST (13%), graduated income tax |
| 4 | British Columbia | 30.7% | No PST on groceries, moderate property taxes, carbon tax rebates |
| 5 | Manitoba | 31.2% | Low PST (7% until 2024, now increasing), modest income tax |
| 6 | New Brunswick | 32.8% | Moderate HST (15%), competitive income tax for lower-middle income |
| 7 | Newfoundland & Labrador | 33.1% | Moderate HST (15%), recent income tax reductions |
| 8 | Prince Edward Island | 33.4% | Moderate HST (15%), some recent tax relief measures |
| 9 | Nova Scotia | 34.2% | HST (15%), higher income tax rates |
| 10 | Quebec | 35.9% | Highest income tax, QST, QPP, QPIP, multiple provincial levies |
Important caveat: These rankings shift based on income level. A high-income earner faces a different provincial ranking than a low-income earner because progressive income tax systems create different marginal and average effective rates at different income levels.
Province-by-Province Deep Dive
1. Alberta: The Tax Advantage Leader
Alberta has consistently maintained the lowest total tax burden in Canada for middle and high-income earners. The provincial tax advantage is built on several pillars:
Provincial Income Tax (2026)
Alberta uses a flat-rate provincial income tax system (recently reintroduced after a brief period of progressive brackets):
| Bracket | Rate |
|---|---|
| All income | 10% |
This simplicity contrasts sharply with other provinces that have progressive bracket systems reaching 15% to 25.75% at the top end.
Example: An Albertan earning $100,000 pays $10,000 in provincial income tax. The same earner in Ontario pays approximately $7,200 (due to progressive brackets being lower at mid-income levels but higher at the top), while a Quebecer pays approximately $15,000.
No Provincial Sales Tax
Alberta is the only Canadian province without a provincial sales tax. Albertans pay only the federal GST of 5% on most goods and services. This creates a 5 to 8 percentage point price advantage on consumer spending compared to provinces with HST or PST/GST combinations.
Annual savings for typical household: Approximately $2,400 to $3,600 on annual consumer spending of $60,000 to $70,000.
No Provincial Health Premium
Unlike British Columbia (which had a health premium until 2020, now replaced by an employer health tax) and Ontario (which eliminated its health premium in 2022), Alberta has never levied a direct health premium on residents.
Property Taxes
Alberta's municipal property taxes are moderate but vary significantly by municipality:
| Municipality | Median Property Tax (Single-family Home, 2026) |
|---|---|
| Calgary | $3,800 to $4,500 |
| Edmonton | $3,200 to $4,000 |
| Lethbridge | $2,800 to $3,400 |
| Red Deer | $2,600 to $3,200 |
These rates are competitive with or lower than comparable urban centers in other provinces.
Carbon Tax
Alberta has a provincial carbon tax (reintroduced after federal imposition) currently set at $80 per tonne. This adds approximately $0.18 per liter to gasoline prices and increases heating costs. However, Alberta provides carbon tax rebates to lower and middle-income households, partially offsetting this cost.
The High-Income Advantage
Alberta's flat income tax rate becomes particularly advantageous at high income levels. A household earning $200,000 in Alberta pays approximately $36,000 less in combined federal and provincial income tax than the same household in Quebec, and approximately $14,000 less than in Ontario.
This high-income tax advantage has made Alberta particularly attractive to high-earning professionals, entrepreneurs, and executives, contributing to significant interprovincial migration from BC, Ontario, and the Atlantic provinces.
What You Don't Get
Alberta's lower tax burden comes with tradeoffs:
- Public services, particularly healthcare, have faced significant capacity constraints and wait times comparable to or worse than higher-tax provinces
- Post-secondary education tuition is not among the lowest in Canada
- Public infrastructure investment has been uneven, with boom-bust cycles tied to resource revenues
- Childcare costs are among the highest in Canada (though recent federal agreements are changing this)
2. Saskatchewan: The Prairie Middle Path
Saskatchewan occupies an interesting middle position: lower taxes than most provinces, but not as aggressively low as Alberta. The province has historically balanced modest taxation with reasonable public service delivery.
Provincial Income Tax (2026)
| Taxable Income | Rate |
|---|---|
| Up to $49,720 | 10.5% |
| $49,721 to $142,058 | 12.5% |
| Over $142,058 | 14.5% |
Provincial Sales Tax
Saskatchewan levies a 6% PST on most goods and services, plus the 5% federal GST, for a combined rate of 11% — lower than any HST province and 2 percentage points lower than BC's combined rate.
Exemptions: Groceries, children's clothing, prescription drugs, and some agricultural inputs are exempt from PST.
Property Taxes
Saskatchewan property taxes are moderate to low compared to national averages:
| Municipality | Median Property Tax (2026) |
|---|---|
| Saskatoon | $3,400 to $4,200 |
| Regina | $3,600 to $4,400 |
| Smaller centers | $2,200 to $3,000 |
Public Services Balance
Saskatchewan has invested relatively consistently in healthcare and education, maintaining wait times and service levels that are average to above-average by Canadian standards. The province has avoided some of the boom-bust volatility that has characterized Alberta's public service funding.
3. Ontario: Canada's Most Populous, Moderate Tax Burden
Ontario is home to approximately 38% of Canada's population and represents a moderate tax burden relative to other provinces. For middle-income earners, Ontario is competitive. For high-income earners, Ontario's top marginal rate makes it less attractive than western provinces.
Provincial Income Tax (2026)
| Taxable Income | Rate |
|---|---|
| Up to $51,446 | 5.05% |
| $51,447 to $102,894 | 9.15% |
| $102,895 to $150,000 | 11.16% |
| $150,001 to $220,000 | 12.16% |
| Over $220,000 | 13.16% |
Ontario's progressive structure means that low and middle-income earners face relatively modest provincial tax rates, but high earners face a top combined federal-provincial marginal rate of 53.53% — among the highest in North America.
Harmonized Sales Tax (HST)
Ontario levies a 13% HST (8% provincial + 5% federal). Groceries, prescription drugs, and residential rent are exempt.
No Health Premium (Eliminated 2022)
Ontario eliminated its Ontario Health Premium in 2022, removing a levy that had added up to $900 annually for high-income earners and $300 to $600 for middle-income earners.
Property Taxes
Ontario property taxes vary enormously by municipality. Toronto has relatively high property taxes in absolute terms but moderate rates relative to property values. Smaller cities and rural areas have lower absolute property taxes but higher mill rates.
| Municipality | Median Property Tax (2026) |
|---|---|
| Toronto | $4,800 to $6,500 |
| Ottawa | $4,200 to $5,500 |
| Hamilton | $4,000 to $5,200 |
| London | $3,600 to $4,800 |
| Smaller cities | $2,800 to $4,000 |
The GTA Cost Reality
While Ontario's tax burden is moderate by Canadian standards, the Greater Toronto Area's cost of living — driven primarily by housing costs — creates significant financial pressure that is distinct from but related to the tax burden. A household paying $3,000 per month in rent or $4,500 in mortgage payments experiences financial constraint regardless of the tax structure.
4. British Columbia: Natural Beauty, Moderate Taxes
British Columbia presents a complex tax picture. The province's provincial income tax rates are progressive and moderately high at upper-income levels, but various credits, exemptions, and rebates mean that effective tax burdens vary significantly by household composition and location.
Provincial Income Tax (2026)
| Taxable Income | Rate |
|---|---|
| Up to $47,937 | 5.06% |
| $47,938 to $95,875 | 7.7% |
| $95,876 to $110,076 | 10.5% |
| $110,077 to $133,664 | 12.29% |
| $133,665 to $181,232 | 14.7% |
| $181,233 to $252,752 | 16.8% |
| Over $252,752 | 20.5% |
BC's top marginal rate of 20.5% (combined federal-provincial: 53.5%) is the highest in Canada alongside Quebec and Nova Scotia, making BC one of the least attractive provinces for very high earners from a tax perspective.
Provincial Sales Tax (PST)
BC levies a 7% PST on most goods, plus the 5% federal GST, for a combined 12% rate. However, PST exemptions are broader than in many provinces:
PST-exempt in BC:
- Groceries
- Restaurant meals (below $4 per item, rarely applicable in practice)
- Children's clothing and footwear
- Books and newspapers
- Prescription drugs
- Bicycles under $1,000
- Some green products and energy-efficient goods
Carbon Tax and Climate Action Incentive
BC pioneered North America's first broad-based carbon tax in 2008. The current rate is $80 per tonne (2026), adding approximately $0.18 per liter to gasoline. However, BC provides a Climate Action Tax Credit to low and middle-income households, offsetting much of this cost for those with incomes below $60,000.
Property Taxes
BC property taxes are moderate in most of the province but high in Metro Vancouver due to elevated property values:
| Region | Median Property Tax (2026) |
|---|---|
| Metro Vancouver | $4,500 to $7,500 |
| Victoria | $4,000 to $5,500 |
| Kelowna | $3,500 to $4,800 |
| Smaller BC cities | $2,500 to $3,800 |
BC's Progressive Credits and Supports
BC offers a suite of income-tested tax credits that reduce the effective tax burden for lower and middle-income households:
- BC Climate Action Tax Credit
- BC Early Childhood Tax Benefit
- BC Sales Tax Credit
- BC Renter's Tax Credit (proposed expansion in 2026)
These credits mean that BC's effective tax burden for a low-income household with children can be significantly lower than the province's nominal tax rates would suggest.
5. Manitoba: The Overlooked Middle
Manitoba occupies a middle position in Canadian tax competitiveness: not the lowest burden, but significantly lower than the Atlantic provinces and Quebec. The province has historically maintained relatively modest taxation while delivering reasonable public services.
Provincial Income Tax (2026)
| Taxable Income | Rate |
|---|---|
| Up to $47,000 | 10.8% |
| $47,001 to $100,000 | 12.75% |
| Over $100,000 | 17.4% |
Manitoba's top rate of 17.4% (combined federal-provincial: 50.4%) is high relative to western provinces but lower than Atlantic provinces and Quebec.
Provincial Sales Tax (PST)
Manitoba has a 7% PST plus 5% GST, for a combined rate of 12%. The Manitoba NDP government elected in 2023 paused a planned PST reduction, keeping the rate at 7% rather than reducing it to 6% as the previous Progressive Conservative government had planned.
PST exemptions: Groceries, prescription drugs, children's clothing, books.
Property Taxes
Manitoba property taxes are moderate, with Winnipeg's rates being competitive with other prairie cities:
| Municipality | Median Property Tax (2026) |
|---|---|
| Winnipeg | $3,200 to $4,200 |
| Brandon | $2,600 to $3,400 |
| Smaller centers | $2,000 to $3,000 |
Public Service Delivery
Manitoba has maintained reasonably strong public healthcare and education systems relative to its tax burden, though the province faces ongoing challenges with healthcare wait times and physician recruitment in rural areas.
The High-Tax Provinces: What You Pay For (Or Don't)
At the other end of the spectrum, Quebec, Nova Scotia, and Prince Edward Island impose the highest total tax burdens in Canada. Understanding what these additional taxes fund — and whether they deliver commensurate value — is essential for evaluating the true cost of living in these provinces.
Quebec: The Distinct Tax Model
Quebec consistently has the highest total tax burden in Canada across nearly all income levels. A middle-income Quebec household pays approximately 9 percentage points more of income in total taxes than an equivalent Alberta household — a difference of approximately $7,500 to $9,000 annually.
Quebec's Tax Stack
| Tax Type | Quebec Rate/Structure |
|---|---|
| Provincial income tax | 15% to 25.75% (highest brackets in Canada) |
| Quebec Sales Tax (QST) | 9.975% (on top of 5% GST) |
| Quebec Pension Plan (QPP) | Slightly higher contribution than CPP |
| Quebec Parental Insurance Plan (QPIP) | 0.494% employee, 0.692% employer (unique to QC) |
| Health contribution | Previously eliminated but reintroduced in modified form |
| Carbon tax | Integrated into Quebec's cap-and-trade system |
What Quebecers Get
Quebec's higher tax burden funds:
- $10/day childcare: Quebec pioneered subsidized childcare in Canada, providing spaces at approximately $10 per day (recently increased to sliding scale up to $20) compared to $1,000 to $2,000 per month in many other provinces (though federal agreements are narrowing this gap)
- Tuition subsidies: Quebec university tuition for residents is the lowest in Canada, approximately $3,000 to $4,000 annually compared to $6,000 to $9,000 in other provinces
- Generous parental leave: Quebec's QPIP provides more generous parental leave benefits than federal EI parental benefits
- Public auto insurance: Quebec's government-run SAAQ provides basic auto insurance at rates generally below private insurance in other provinces
- More extensive social services: Higher per-capita spending on social services, community health, and seniors' care
For households with young children and university-aged students, Quebec's higher tax burden can be partially or fully offset by lower childcare and education costs. For households without children, or with children past university age, Quebec's tax burden provides less direct return.
How Income Level Changes the Rankings
Tax burden rankings are not static across income levels. Progressive income tax systems, income-tested credits, and proportional consumption taxes create very different provincial tax hierarchies depending on whether you earn $40,000, $100,000, or $250,000 annually.
Low-Income Household ($40,000, Single Adult)
| Province | Total Tax Burden | Key Factors |
|---|---|---|
| Alberta | 18.2% | Low income tax, no PST, federal GST credit |
| Saskatchewan | 19.8% | Low PST, income-tested credits |
| Manitoba | 20.1% | Modest income tax at low brackets |
| BC | 20.4% | Extensive income-tested credits |
| Ontario | 20.9% | HST but some credit offsets |
At low income levels, the absence of provincial sales tax in Alberta remains advantageous, but the gap between provinces narrows because:
- Federal GST/HST credits are generous for low-income households
- Provincial income tax rates are lowest at the bottom brackets in most provinces
- Income-tested provincial credits in BC, Ontario, and Quebec reduce effective burden
Middle-Income Household ($100,000, Married, Two Children)
This is the income level at which the rankings presented at the beginning of this article apply. Alberta's advantage widens significantly at middle income because:
- Flat 10% provincial rate is lower than most provinces' mid-bracket rates
- No PST saves approximately $3,000 to $4,000 annually
- Family-related credits are available across provinces, equalizing that dimension
High-Income Household ($250,000+, Married, No Children)
| Province | Total Tax Burden | Key Factors |
|---|---|---|
| Alberta | 31.4% | Flat 10% income tax rate, no PST |
| Saskatchewan | 35.1% | Lower top rate than eastern provinces |
| Ontario | 38.2% | 13.16% top provincial rate, HST |
| BC | 39.8% | 20.5% top rate, highest combined marginal |
| Quebec | 42.1% | 25.75% top rate, QST, QPP/QPIP |
At high income levels, Alberta's flat tax rate creates an enormous advantage. The difference between Alberta and Quebec for a $300,000 income household is approximately $32,000 to $38,000 per year in total taxes — enough to fully fund an RRSP, pay for private education, or accelerate mortgage payoff.
This high-income tax differential is the primary driver of interprovincial migration among executives, entrepreneurs, medical specialists, and other high-earning professionals.
The Migration Reality: Voting With Their Feet
Provincial tax differentials are not abstract policy debates. They drive real human decisions about where to live, work, and build wealth. Statistics Canada's interprovincial migration data reveals clear patterns:
Net Interprovincial Migration (2024-2025)
| Province | Net In-Migration | Primary Source Provinces |
|---|---|---|
| Alberta | +45,200 | BC, Ontario, Atlantic Canada |
| Saskatchewan | +8,400 | Manitoba, Ontario |
| BC | +12,100 | Alberta (returning), Ontario |
| Ontario | -18,300 | To Alberta, BC, Atlantic Canada |
| Quebec | -12,800 | To Ontario, Alberta |
| Atlantic Provinces | -8,600 | To Ontario, Alberta, BC |
| Manitoba | -3,200 | To Saskatchewan, Alberta |
The Alberta Effect: Alberta's sustained net in-migration of 40,000 to 50,000 people annually over the past five years is driven by a combination of factors, but tax burden is consistently cited in surveys as a top-three consideration for movers. High-income professionals and families in their peak earning years (30s to 50s) are disproportionately represented among Alberta-bound migrants.
The BC-Alberta Shuttle: A notable pattern is high-earning British Columbians relocating to Alberta for their peak earning and wealth accumulation years (40s to 60s), then returning to BC for retirement. This allows them to accumulate wealth in a lower-tax jurisdiction, then enjoy BC's climate and amenities while drawing down savings that were taxed at Alberta's lower rates during accumulation.
Property Taxes: The Hidden Burden
Provincial income and sales taxes receive the most attention in tax burden discussions, but property taxes — levied primarily by municipalities with provincial oversight — represent a significant and often underestimated component of household tax burden.
Average Residential Property Tax by Province (2026)
| Province | Average Annual Property Tax (Single-Family Home) | Notes |
|---|---|---|
| New Brunswick | $2,400 to $3,200 | Lowest absolute property taxes in Canada |
| Quebec (outside Montreal) | $2,600 to $3,800 | Low property values, modest rates |
| Saskatchewan | $3,000 to $4,000 | Moderate rates, moderate values |
| Alberta | $3,200 to $4,500 | Higher in Calgary and Edmonton |
| Manitoba | $3,200 to $4,200 | Competitive rates |
| Ontario (outside GTA) | $3,400 to $4,800 | Wide variation by municipality |
| Nova Scotia | $3,600 to $5,200 | Higher values in Halifax |
| BC (outside Metro Vancouver) | $3,500 to $5,000 | Moderate rates |
| Ontario (GTA) | $4,500 to $6,800 | High absolute taxes due to property values |
| BC (Metro Vancouver) | $5,000 to $8,500 | Very high property values drive high absolute taxes |
Property taxes are particularly challenging for retirees and others on fixed incomes who own property in markets where values have appreciated dramatically. A Vancouver homeowner who purchased a modest home for $300,000 in 1995 may now own a property assessed at $1.8 million, generating an annual property tax bill of $6,000 to $8,000 — a burden that can be difficult to sustain on CPP, OAS, and modest retirement savings, even if the household is "asset rich."
What Low Taxes Buy (And What They Don't)
The relationship between tax burden and public service quality is complex and not always linear. Some lower-tax provinces deliver excellent public services through efficiency, resource revenues, or federal transfers. Others deliver mediocre services. Some high-tax provinces deliver exceptional services. Others do not.
Healthcare Wait Times and Tax Burden
There is no clear correlation between provincial tax burden and healthcare outcomes:
| Province | Tax Burden Rank | Median Wait Time (GP to Specialist to Treatment, 2025) |
|---|---|---|
| Alberta | 1 (lowest) | 27.3 weeks |
| Saskatchewan | 2 | 31.8 weeks |
| Ontario | 3 | 25.6 weeks |
| BC | 4 | 25.9 weeks |
| Manitoba | 5 | 28.5 weeks |
| Quebec | 10 (highest) | 24.7 weeks |
Quebec, despite having the highest tax burden, actually has slightly better wait times than some lower-tax provinces, suggesting that factors beyond pure tax revenue levels — including system design, physician distribution, and administrative efficiency — matter enormously.
Education Outcomes
Similarly, provincial tax burden does not directly predict education quality. Alberta students consistently score near the top on national and international assessments (PISA, PCAP) despite moderate per-student education spending. Quebec students also score highly despite language-of-instruction complexities. Saskatchewan and Manitoba have historically lagged despite moderate tax burdens and reasonable education spending.
Infrastructure Quality
Infrastructure spending and maintenance are areas where tax burden shows somewhat clearer relationships. Higher-tax provinces like Quebec have invested more consistently in public infrastructure (roads, bridges, transit, public buildings). Lower-tax provinces like Saskatchewan and Manitoba have faced infrastructure deficits during periods of restrained provincial revenues.
Alberta's infrastructure spending has been highly volatile, reflecting the boom-bust cycles of resource revenues, with periods of aggressive investment followed by periods of deferred maintenance.
Corporate Taxes and Business Competitiveness
While this analysis focuses on personal tax burden, provincial corporate tax rates and business tax environments are relevant because they influence economic growth, job creation, and indirectly, household prosperity.
Provincial Corporate Income Tax Rates (2026)
| Province | General Rate | Small Business Rate | Combined Federal-Provincial Rate |
|---|---|---|---|
| Alberta | 8% | 2% | 23% general, 11% small |
| Saskatchewan | 12% | 1% | 27% general, 10% small |
| BC | 12% | 2% | 27% general, 11% small |
| Ontario | 11.5% | 3.2% | 26.5% general, 12.2% small |
| Manitoba | 12% | 0% | 27% general, 9% small |
| Quebec | 11.5% | 4% | 26.5% general, 13% small |
Alberta's 8% general corporate rate is the lowest in Canada and competitive with US states, making the province attractive for corporate headquarters, regional operations, and business investment. This business-friendly tax environment has contributed to Alberta's strong job creation and wage growth in professional services, technology, and energy sectors.
The Retirement Planning Dimension
Provincial tax burden has particularly significant implications for retirement planning. Retirees have more geographic flexibility than working-age Canadians (who are tied to employment locations) and can choose their province of residence strategically based on tax considerations.
Provincial Tax Treatment of Retirement Income (2026)
| Province | Pension Income Credit | Age Amount Enhancement | Additional Senior-Specific Credits | Overall Retiree Tax Environment |
|---|---|---|---|---|
| Alberta | Standard federal credit | Standard federal credit | None | Very favorable (low income tax, no PST) |
| Saskatchewan | Enhanced provincial credit | Moderate | Some property tax relief programs | Favorable |
| BC | Standard federal credit | Enhanced provincial credit | Enhanced property tax deferral | Favorable for low-income seniors, moderate for high-income |
| Ontario | Standard federal credit | Standard federal credit | Property tax grants for low-income seniors | Moderate |
| Manitoba | Standard federal credit | Standard federal credit | Education property tax credit for seniors | Moderate |
| Quebec | Different structure (non-integrated) | Different structure | Multiple age-based credits | Mixed (high taxes but good services for seniors) |
Strategic retirement relocation: A growing number of Canadian retirees are relocating from high-tax to low-tax provinces specifically to minimize taxes on retirement income drawdowns. A retiree drawing $80,000 annually from RRIF and pension income can save $3,000 to $6,000 per year by residing in Alberta rather than Ontario or BC, and $8,000 to $12,000 per year compared to Quebec.
Over a 20 to 25 year retirement, these savings compound to $60,000 to $300,000 — a meaningful addition to retirement security. Understanding the best age to start retirement planning includes considering these geographic tax optimization strategies.
The Future: Where Provincial Tax Policy Is Heading
Provincial tax policy is not static. Fiscal pressures, political shifts, and economic conditions are reshaping the tax landscape across Canada:
Trends to Watch
Alberta's fiscal sustainability: Alberta's low-tax model is partially subsidized by volatile resource revenues. Periods of low oil and gas prices create budget pressures that have historically resulted in public service cuts rather than tax increases. The long-term sustainability of Alberta's tax advantage depends on economic diversification and prudent fiscal management.
Federal-provincial tension over carbon pricing: The federal carbon tax is increasing annually to $170 per tonne by 2030, adding approximately $0.37 per liter to gasoline prices. Provinces that refuse to implement equivalent provincial systems face federal imposition. This is creating significant interprovincial variation in how carbon pricing is implemented and rebated, with major implications for total tax burden.
Healthcare spending pressure: Every Canadian province faces identical demographic pressures from an aging population requiring more healthcare spending. This structural pressure will drive tax increases, spending cuts, or both across all provinces over the next decade. Lower-tax provinces may find their tax advantage eroding as they confront these realities.
Childcare funding equalization: Federal childcare agreements are narrowing the historic gap between Quebec's subsidized childcare and other provinces. As $10-a-day childcare becomes more widely available across Canada by 2026-2027, one of Quebec's major high-tax value propositions diminishes.
How to Minimize Your Provincial Tax Burden
For Canadians concerned about tax burden, several strategic options exist:
1. Strategic Provincial Residence Choice
If your employment is location-flexible (remote work, self-employment, consulting), or if you are retired, choosing to reside in a low-tax province can generate substantial lifetime tax savings. This is particularly valuable during high-income years.
Considerations:
- Cost of living beyond taxes (especially housing)
- Quality of public services you value
- Climate and lifestyle preferences
- Family and social connections
- Access to specialized healthcare or education
2. Income Splitting and Tax Efficiency
Regardless of province, strategic use of spousal RRSPs, pension income splitting, and TFSA maximization reduces effective tax burden. These strategies have similar benefits across provinces but are particularly valuable in high-tax provinces where marginal rates are highest.
3. Incorporate If Self-Employed
Self-employed Canadians earning over approximately $80,000 to $100,000 can reduce lifetime tax burden through incorporation, income splitting through a family corporation, and small business tax deferral. This strategy is valuable in all provinces but particularly valuable in high-tax provinces like Quebec, BC, and Nova Scotia where the spread between personal and corporate rates is widest.
4. Max Out Tax-Advantaged Accounts
RRSPs and TFSAs are province-neutral: they provide identical federal tax treatment regardless of residence. However, RRSP deductions are more valuable in high-tax provinces (because deductions save tax at higher marginal rates) while TFSA withdrawals are equally valuable everywhere (because they are tax-free regardless of province).
High-tax province residents should prioritize RRSP contributions during high-income years. Low-tax province residents should prioritize TFSA contributions.
5. Strategic Timing of Income and Deductions
If you plan to move between provinces, the timing of income recognition and deduction claims can be optimized. Recognize income in low-tax years (or low-tax provinces), claim deductions in high-tax years (or high-tax provinces).
Example: If you are relocating from BC to Alberta mid-career, consider deferring bonuses or consulting income until after your Alberta move. Conversely, maximize RRSP deductions while still resident in BC to get the deduction at BC's higher marginal rate.
Frequently Asked Questions
Does the lowest-tax province give the best quality of life? Not necessarily. Quality of life is multidimensional. Alberta has the lowest taxes but also the harshest winters (outside southern BC), longer distances between cities, and fewer cultural amenities than Toronto, Vancouver, or Montreal. Quebec has high taxes but extraordinary cultural richness, affordable housing outside Montreal, and generous childcare and education subsidies. The "best" province depends on your values, life stage, and priorities.
Can I legally live in one province and claim tax residency in another? No. Provincial tax residency is based on where you actually reside on December 31 of the tax year, not where you wish to be taxed. The Canada Revenue Agency (CRA) uses multiple factors to determine provincial residence including your primary dwelling, where your spouse and dependents live, where your personal property is located, and where you maintain social and economic ties. Attempting to claim residency in a low-tax province while actually residing in a high-tax province is tax evasion and carries significant penalties.
What about people who own property in multiple provinces? If you own homes in multiple provinces, your tax residency is determined by your primary residence — the place where you have the strongest residential ties. CRA considers factors like where you spend most of your time, where your family lives, where your vehicles are registered, and where your driver's license and health card are issued. Most Canadians with multiple properties establish one clear primary residence and treat others as vacation or investment properties.
Do lower-tax provinces have worse public services? Not necessarily. The relationship between tax burden and service quality is complex. Alberta has the lowest taxes but delivers healthcare and education outcomes comparable to or better than some higher-tax provinces. Efficiency, resource revenues, federal transfers, and policy priorities all matter. However, sustained underfunding eventually degrades services, and lower-tax provinces that rely on volatile resource revenues can experience boom-bust cycles in service quality.
Should I move to Alberta just for the tax savings? Only if the full package — employment opportunities, lifestyle, climate, community — works for your situation. Tax savings are meaningful, but they are one factor among many. A $5,000 annual tax saving matters less if you are miserable, isolated from family, or struggling to find fulfilling work. However, for high-income earners in location-flexible careers, Alberta's tax advantage can justify the move, particularly during peak earning years (40s and 50s).
How much can I actually save by living in a low-tax province? The savings depend on your income level and household composition:
- Low income ($40,000): $800 to $1,200 annually between lowest and highest tax provinces
- Middle income ($100,000): $7,000 to $9,500 annually between Alberta and Quebec
- High income ($250,000): $30,000 to $38,000 annually between Alberta and Quebec
Over a 20 to 30 year career, these differences compound to hundreds of thousands of dollars — enough to retire years earlier or build substantial wealth.
Are there provinces with low income tax but high sales tax, or vice versa? Yes. Provincial tax structures vary:
- Alberta: Low income tax, no PST (pure low-tax model)
- Saskatchewan: Moderate income tax, low PST (balanced model)
- Ontario: Progressive income tax (low at bottom, moderate at top), moderate HST
- BC: High top-bracket income tax, moderate PST
- Quebec: High income tax, high sales tax (comprehensive high-tax model)
Some provinces lean more heavily on income taxes (progressive, affects high earners more), others on consumption taxes (regressive, affects all consumers relatively equally).
Can I reduce my tax burden without moving provinces? Yes. Strategic tax planning can meaningfully reduce your effective tax burden regardless of province:
- Maximize RRSP contributions to reduce taxable income
- Maximize TFSA contributions for tax-free growth
- Use spousal RRSP contributions for income splitting
- Incorporate if self-employed and earning sufficient income
- Pension income splitting in retirement (available at age 65)
- Claim all available credits (childcare, disability, medical expenses, charitable donations)
- Use capital gains and dividend income strategies where appropriate
These strategies do not eliminate provincial tax differences but can reduce your effective burden by several percentage points.
Do Canadian provinces have estate or inheritance taxes? No. Canada has no estate tax, inheritance tax, or death tax at the federal or provincial level. However, Canada does have a "deemed disposition" rule: when you die, you are deemed to have sold all your capital assets at fair market value immediately before death, triggering capital gains tax on any appreciation. This is not technically an estate tax, but it functions similarly. Quebec also has additional probate fees higher than most provinces.
Related Articles
- The Best Age to Start Retirement Planning
- Why More Canadians Are Working After Retirement
- How Canada's Aging Population Is Impacting Healthcare
- Best Jobs in BC for PR in 2026
- Provinces Offering the Most Immigration Opportunities in 2026
- BC International Graduate Stream: Complete Guide for 2026
- Is Canada's Immigration Boom Making Life Harder for Canadians?
Sources
- Fraser Institute: Canada's Tax Burden and Economic Freedom Report 2026 — https://www.fraserinstitute.org/
- C.D. Howe Institute: Provincial Tax Competitiveness Analysis — https://www.cdhowe.org/
- Statistics Canada: Provincial Economic Accounts and Tax Statistics — https://www.statcan.gc.ca/
- Canada Revenue Agency: Provincial and Territorial Tax Rates — https://www.canada.ca/en/revenue-agency.html
- Government of Alberta: Tax and Revenue Policy — https://www.alberta.ca/
- Government of Saskatchewan: Finance and Tax Policy — https://www.saskatchewan.ca/
- Government of Ontario: Ministry of Finance Tax Information — https://www.ontario.ca/page/ministry-finance
- Government of British Columbia: Ministry of Finance — https://www2.gov.bc.ca/gov/content/governments/organizational-structure/ministries-organizations/ministries/finance
- Government of Quebec: Revenu Québec Tax Information — https://www.revenuquebec.ca/
- Canadian Taxpayers Federation: Provincial Tax Analysis 2026 — https://www.taxpayer.com/
- Conference Board of Canada: Provincial Economic Performance and Tax Policy — https://www.conferenceboard.ca/
- CIHI: Healthcare Spending and Outcomes by Province — https://www.cihi.ca/
- Statistics Canada: Interprovincial Migration Data — https://www.statcan.gc.ca/
- Ministry of Finance Ontario: Tax Expenditures and Evaluations — https://www.ontario.ca/page/ministry-finance
- Alberta Treasury Board and Finance: Fiscal Plan and Budget Documents — https://www.alberta.ca/treasury-board-and-finance